To
simulate impact situations, data at high strain rate is also needed.
The UTM is usually too slow for this kind of test. This article
presents a 3 point bending test method using an impact tower at
much greater velocities. Solutions are presented to reduce noise
due to vibrations in the system. The set up is tested using a Montell
Polypropylene and the results show good consistency for modulus,
yield stress and strain at yield.
The impact tower
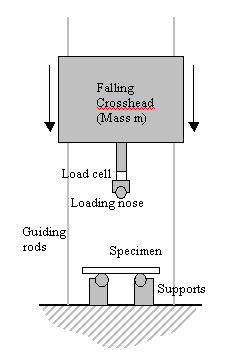
The impact tower is generally used
to obtain load deflection curves from disk specimens [6]. A heavy
crosshead is dropped from a variable height, falling along 2 guiding
rods (figure 1). A load cell at the tip of the tup records the load
during the impact. When the crosshead goes through a flag, the acquisition
of the data from the load cell starts and the velocity is recorded.
After the failure of the specimen, two shock absorbers stop the
fall of the crosshead.
For the high velocity 3 point
bending test, a loading nose is attached to the tup. The specimen
rests on 2 cylindrical supports. It is placed dirtectly below the
crosshead, so that the loading nose strikes the beam in its center.
During the impact, the load is recorded with the load cell. The
load-time curve is processed to obtain a force-deflection curve.
The momentum conservation applied to the crosshead only gives:
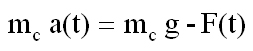 (1)
(1)
Where:
mc is the mass of the crosshead
a(t) is the acceleration of the crosshead
g is the gravity
F(t) is the force
Integrating once gives the velocity:
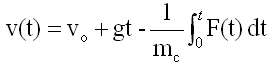 (2)
(2)
Where vo is the velocity at the flag.
Integrating a second time gives the displacement
of the crosshead from the flag:
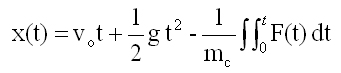 (3)
(3)
The deflection d at the center of the beam is
then obtained by removing the distance flag-specimen from x(t).
It can be argued that the force measured is not the actual force
experienced by the specimen, because of the inertia of
the loading nose. The conservation of momentum applied to the loading
nose assuming that it sees the same acceleration as the crosshead
gives:
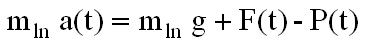 (4)
(4)
Where:
mln is the mass of the loading nose
P(t) is the force exerted by the specimen on the loading nose.
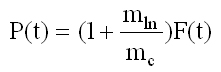 (5)
(5)
In the set up, mln is very small compared
to mc, so that P(t)~F(t).
Stress and Strain calculation
From the load-deflection curve,
the stresses and strains can be determined. Assuming small deformations,
the engineering strain at the outer fiber of the beam is given by:
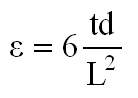 (6)
(6)
Where d is the deflection of the beam at its
center, t is the thickness of the specimen and L is the span. The
strain rate at the outer fiber is therefore given by:
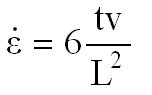 (7)
(7)
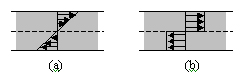
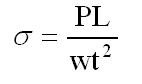
Where v is the velocity of the crosshead. Assuming
linear elasticity (figure 2a), the stress at the outer fiber is
given by:
Where v is
the velocity of the crosshead. Assuming linear elasticity (figure
2a), the stress at the outer fiber is given
by:
 (8)
(8)
Where P is the load at the center of the beam
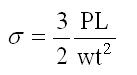
and w is the width of the specimen. If we assume perfectly and totally
plastic deformation at yield in the center of the beam (figure 2b),
the stress should be written [2]:
 (9)
(9)
Experimental set up
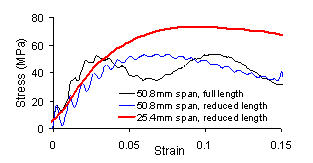
The first experiments are performed
on a Polypropylene specimen. The span used is 50.8mm. The stress-strain
curves are calculated using a linear elastic approach. The resulting
stress-strain curve is showed on figure 4. Low frequency vibrations
heavily perturb the overall shape of the response. It is then difficult
to obtain material properties from the curve. The goal is therefore
to find a set up so that the period of the oscillations is much
smaller than the duration of the test. If necessary, filters can
be uses to smooth the curve without altering its overall shape.
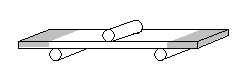
A closer look at the mechanics of the test shows that the parts
of the beam which are outside the bending region (gray areas on
figure 3) increase the inertia of the system. By removing them,
the natural frequencies of the beam should increase. The same test
is therefore performed with a “reduced length” beam
using the same span. The resulting stress strain curve is shown
on figure 4. Removing the sides of the specimen clearly improves
the quality of the signal.
Another way to reduce the increase the natural frequencies of the
beam is to reduce the span. A 25.4mm span beam with reduced length
is tested, adjusting the velocity so that the strain rate at the
outer fiber is the same as when using a 50.8mm span (100 s-1) according
to equation 7. Figure 4 shows that the quality of the signal is
again enhanced. The curves show another effect: The reduction of
the span increases the calculated yield stress. A more appropriate
model for the stress calculation, currently in development, should
be used to remove this discrepancy.
Results
Three point bending experiments are
performed at different strain rates, using a 25.4mm span on a Montell
polypropylene. An Instron UTM is used for low strain rates, and
a Dynatup impact tower is used for high rates of strain.
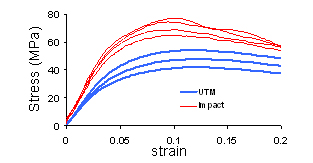
The stress-strain curves are obtained using a linear elasticity
approximation. The resulting stress-strain curves are shown on figure
5. The lowest 3 curves were obtained using the UTM with strain rates
ranging from 0.0025
s-1 to 0.25 s-1 at the outer fiber. The highest curves
(thinner) were obtained using the impact tower with strain rates
ranging from 25 s-1 to 115 s-1.
The weight of the crosshead should insure a minimum velocity slow
down during the test. Using a 12kg crosshead weight, the velocity
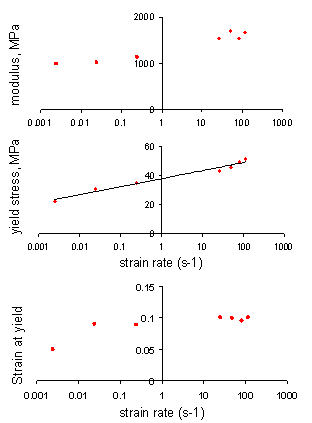
actually increases during the impact. The modulus, yield stress
and yield strain are also plotted as a function of strain rate (figure
6).
-The modulus increases with
the strain rate, which is consistent with a viscoelastic approach.
-The yield stress is calculated assuming a total
and perfect plastic state at yield, using equation 9. The yield
stress increases with strain rate and follows the Eyring theory
for the yielding of polymers: it increases linearly with the logarithm
of the strain rate [4].
-The strain at yield increases at
very low strain rates and does not significally vary for higher
rates of strain.
Conclusion
A methodology for 3 point bending
tests at high rate of strain has been presented. Specific set ups
have been shown to reduce the vibrations in the system, which has
been a major problem in the past attempts. A family of stress-strain
curves has been obtained for a Polypropylene. The results showed
encouraging results, consistent with viscoelastic and yielding theories.
The experiments also showed a dependence of calculated yield stress
with the span used.
The model currently used to determine the stress at yield at the
center of the beam should be improved to take the effect of the
span in account. Different aspect ratios for the specimen will also
be tested in the future.
References
1. H. Lobo and J. Lorenzo: “High
Speed Stress-Strain Material Properties As Inputs For The Simulation
Of Impact Situations”. IBEC Proceedings, 1997.
2. G. Trantina and P. Oehler: “Standardization, Is It Leading
To More Relevant Data For Design Engineers?”. SPE ANTEC Proceedings,
1994.
3. L.E. Nielsen and R.F. Landel: “Mechanical Properties Of
Polymers And Composites” (2nd edition). L.L. Faulkner, 1994.
4. N. G. McCrum, C. P. Buckley and C. B. Bucknall: “Principle
Of Polymer Engineering” 2nd edition. Oxford Science Publications,
1997.
5. ASTM D 790 (Plastics): “Standard Tests Methods for Flexural
Properties of Unreinforced and Reinforced Plastics and Electrical
Insulating Materials”.
6. ASTM D 3763 (Plastics): “Standard Tests Method for High
Speed Puncture Properties of Plastics Using Load and Displacement
Sensors”
Acknowledgments
The authors wish to thank Eric
Dunbar from Dynatup for his technical support on the impact tower,
and Jim Lorenzo from Montell for providing the specimens.
|