PVT data first gained prominence when it was used to model compressibility
in computer simulations of the packing phase of the injection molding
process[1]. Plastics are compressible at the high pressures used
in the injection molding process. During the packing phase, most
of the flow results from compressibility. This effect is modeled
using the PVT data. Further, after freeze off, the part begins to
shrink. If the plastic is semi-crystalline, the shrinkage is primarily
due to crystallization. PVT data has been used to model the volumetric
shrinkage of the plastic which is then translated into linear dimensional
changes. However, there have been several limitations in this step.
For reasons described below, the traditional PVT data does not describe
the true characteristics of the injection molded part and limits
the ability of these simulations to correctly predict the shrinkage
of semi-crystalline injection molded products.
Traditional measurements of PVT have used essentially equilibrium
methods; the specimen is equilibrated or is in a state of quasi-equilibrium
at each test temperature prior to taking measurements. Several modes
of measurement have been used [2]. These are outlined below:
1) Isothermal cooling measurements:
Starting from the melt, the polymer is equilibrated at the test
temperature before subjecting it to a compression cycle [3]. It
is then cooled to successively lower temperatures and the compression
process repeated to develop an equilibrium equation of state for
the material. This technique has been in widespread use but suffers
from severe drawbacks. By taking measurements while cooling the
polymer, the technique is intended to capture the correct crystallization
behavior of the plastic. We find from our experiments that this
is not the case. The process of performing compression cycles provides
the driving force needed for nucleation. Consequently, the plastic
crystallizes close to its melting temperature, missing completely
the supercooling effect which is so characteristic of the crystallization
behavior of semi-crystalline polymers. Compare the melting transition
in Figure 2 to the isothermal cooling transition in Figure 4. Most
importantly, it is not possible to replicate the unique “skin-core-skin”
crystalline morphology seen in injection molded products within
a PVT apparatus. The PVT data of the solid state is then an artifact
of the measurement and bears no resemblance to that of the injection
molded part.
2) Isobaric cooling measurements:
The plastic is heated to its melt state and then solidified under
a constant pressure [2]. The process is repeated at other pressures
to develop a complete equation of state. This is also a quasi-steady
state measurement conducted at very low cooling rates. Since the
specimen is not being subject to the compression cycles, it does
need the thermal driving force to crystallize. The supercooling
behavior is correctly observed resulting in transition temperature
shifts that correspond well with those seen by DSC. The pressure
dependency of the transition is also captured correctly. However,
it still suffers from the same drawback as the isothermal cooling
mode: the solid state morphology does not represent that of the
injection molded part. Moreover, several morphologies can be obtained
depending on the pressure at which the polymer is solidified [6].
3) Isothermal heating measurements:
Here, the polymer is taken through a step-wise heating process with
a compression cycle being performed at each equilibrated test temperature
[2]. While well suited to general polymer characterization, the
technique has a drawback in our situation in that it captures the
behavior of the polymer as it melts, rather than as it cools. However,
provided that the test utilizes an injection molded test specimen,
the technique does capture the true solid state PVT behavior of
the injection molded part. It should be pointed out that all three
techniques have equivalent in their ability to characterize the
melt state PVT behavior.
In this paper we present a hybrid scheme whereby we are able to
circumvent the problems faced by the above techniques using a combination
of PVT and DSC measurements. The solution is specific to the characterization
of the PVT behavior of semi-crystalline injection-molded plastics.
Principle
DSC measurements are made on an injection-molded specimen at the
same heating rates as those seen in the PVT measurement. These are
used in the analysis to calibrate the results from one apparatus
against the other. This calibration is necessary to ensure that
there is correspondence between the volume change upon crystallization
observed by the PVT apparatus and the heat evolution occurring during
this process as observed by the DSC. PVT measurements are then performed
on the injection-molded specimen as follows: isothermal heating
measurements are first performed in the solid state over a wide
temperature range. The specimen is then melted at a low pressure
and its melting behavior is recorded. A series of isobaric cooling
measurements are performed at several pressures well into the solid
state. The purpose of these steps is to uniquely measure the solid
state volumetric expansion coefficient and compressibility of the
injection molded specimen, to characterize the melt state PVT behavior
and to determine the slow cooling rate crystallization behavior
of the polymer at different pressures.
Next, high cooling rate DSC measurements are performed to characterize
the rate dependency of the crystallization transition. The purpose
of this experiment is to capture a characteristic high cooling rate
crystallization temperature and its corresponding crystallization
kinetics. The hybrid PVT model is then constructed from the data
gathered by piecing together the measured solid state PVT data of
the injection molded part with the measured melt state PVT properties.
The transition from melt to solid is constructed by transposing
high cooling rate DSC kinetics. The pressure dependence of the transition
temperature is obtained from the isobaric cooling experiments.
Apparatus
A Gnomix Research PVT apparatus [4,5] was used for the high pressure
dilatometry work. The apparatus is fully computerized and capable
of automated operation. It utilizes mercury as the confining fluid.
A Perkin Elmer DSC7 was used for the high and low cooling rate crystallization
studies. The apparatus was calibrated using indium and zinc standards.
Volatile sample pans made from aluminum were used to hold the specimens.
Materials and Methods
The test material was a commercial grade unfilled nylon 66 polymer.
The material was injection molded into test parts which were then
razor cut to the appropriate size.
A 7 mg specimen was loaded into the DSC and melted at 3°C/min.
It was subsequently cooled at 3°C/min. 20°C/min, 40°C/min
and 100°C/min. The resulting heat flow curves are shown in Figure
1. Note that the curves are not normalized for rate. The peak analysis
is shown in Table 1. The dramatic shift in transition is noteworthy.
For the PVT measurements, 1.03 gm of the test specimen was loaded
into the dilatometer. The specimen was subject to isothermal heating
measurements at 10 °C intervals over a range of 30 to 150°C
and a pressure range of 10 to 200 MPa. The specimen was then melted
at 10 MPa (see Figure 2). Isothermal cooling measurements were then
performed at 10 MPa, 40 MPa, and 80 MPa. The resulting data are
shown in Figure 3.
In a separate experiment, conventional isothermal cooling measurements
were conducted to provide a baseline for comparison. These results
are presented in Figure 4.
Data Analysis and Results
A Tait model was fit to the solid state of the PVT data derived
from the isothermal heating measurements. In a similar manner, a
Tait model was fit to the melt state region of the isobaric cooling
measurements. In both cases, data used for the fit excluded measurements
in the transition region, since the transition data was taken at
low cooling rates.
Before transposing data from the DSC to the PVT, an attempt was
made to correlate results from the two instruments. A partial areas
analysis was performed on the 3°C/min fusion peak observed on
the DSC. The corresponding conversion vs temperature data are shown
in Table 2. The total volume change upon fusion was taken from the
PVT data. This volume change was factored over the fusion conversion
data to obtain the calculated volume change at each temperature
as shown in Table. 2. The following equation was used:
v(T) = vs(Te) + {vm(Te) - vs(Te)}*a(T)
where
v(T) = specific volume at temperature T
vs(Te) = specific volume of the solid polymer at the end temperature
of crystallization, Te
vm(Te) = extrapolated specific volume of the polymer if it were
molten at the end temperature of crystallization, Te
a(T) = Degree of crystallization at temperature T
The value of vm(Te) was obtained by extrapolating the melt state
Tait model to the crystallization end temperature. This step serves
to eliminate from the equation, volume changes due to thermal contraction
that have occurred over the temperature range of the crystallization.
Figure 5 shows a plot of the calculated volume against that actually
measured by the PVT apparatus. The DSC peak is also shown. It can
be seen that the calculated points match the measured PVT data well.
A similar calculation (not shown) was performed to correlate DSC
crystallization peaks to PVT crystallization transitions with equally
good results.
With this correspondence, we conclude that the heat released due
to crystallization as measured by the DSC correlates well to the
volume change during crystallization as measured by the PVT apparatus.
It is reasonable to assume that this correlation should hold at
other heating and cooling rates. A partial areas analysis of the
high cooling rate DSC data was transposed to PVT data using the
total volume change occurring due to crystallization. The starting
point of the transition was taken to be at the crystallization onset
temperature observed from the DSC. Similarly, the crystallization
end temperature was also taken from the DSC.
We observed from the isobaric cooling PVT data, that the crystallization
onset temperature varied linearly with pressure over the 10 to 80
MPa pressure range that we covered. This was in agreement with the
findings of He and Zoller [6]. Following their work, we did not
perform measurements at higher pressures due to the possibility
of alternate crystal morphologies being developed. In our analysis,
we assumed that the linear pressure dependency would apply at high
cooling rates as well. Accordingly, the crystallization transition
onset temperature at high pressures was shifted using this pressure
dependency function. For each pressure, transition volumes were
calculated between the crystallization onset temperature and the
crystallization end temperature. The resulting data are shown in
a composite plot (Figure 5) consisting of solid state isothermal
heating measurements on the injection molded part, calculated transition
volumes from DSC and melt state data from isobaric cooling measurements.
For purposes of comparison, the solid state PVT curves from conventional
isobaric cooling measurements are also shown. Note that these data
are significantly lower in the solid state compared to that of the
injection molded part, implying that the slow cooling rates of the
instrument impart a higher crystallinity and a different morphology
than that imparted by the injection molding process.
Discussion
The hybrid technique permits us to examine several aspects of the
PVT behavior of plastics. We observe the effect of super-cooling
on the crystallization temperature. Without considering the effect
of cooling rate, the super-cooling effect results in a crystallization
temperature of 238°C which is 30°C below the melting temperature,
Tm, of 265°C. This correlates well with independent measurements
by DSC. The introduction of high cooling rate effects further depresses
the crystallization temperature to 210°C. For the nylon that
we tested, the total shift in temperature amounted to about 55°C
at a cooling rate of 100°C/min. We also noted that the temperature
range over which the polymer crystallized was wider at high cooling
rates so that at 100°C/min, the crystallization effect was apparent
until 160°C. Consequently, the PVT curves in the transition
are not sharp as typically seen in conventional data, but instead
transition gradually into the solid state.
In modeling the crystallization at higher pressures, we have assumed
that the kinetics are not a function of pressure. This assumption
should be validated through high pressure DSC measurements but this
could not be carried out in our study. The assumption however, permits
us to provide a good first approximation of the volume change upon
crystallization at high pressures and high cooling rates. The ability
to make this calculation is based on our ability to accurately characterize
the change in the crystallization onset temperature with pressure.
The isobaric measurements provide us with a precise means to make
this measurement. In contrast to the isothermal compression methods,
the errors due to pressure induced crystallization are avoided because
the pressure is kept constant during the crystallization process.
In modeling the solid state behavior, we note the depression in
ambient specific volume of the isobaric cooled (or isothermal cooled)
specimen, 0.9402 cm3/g at 32°C and 0 MPa, as compared to the
isothermal heating (or hybrid) measurement of 0.9689 cm3/g. This
difference amounted to a 3% lowering in specific volume. Further,
since the specimen solidified in the apparatus does not possess
the skin-core-skin morphology, we observed that the thermal expansion
coefficients were also higher. The compressibility remained relatively
unchanged. This difference could account, in part, for the overprediction
of shrinkage by the CAE programs [7].
Plastics in injection molded parts cool very quickly. While the
skin layer will freeze at a very high cooling rate, the bulk of
the polymer will cool at a lower rate (in the 100 to 500°C/min
range). We based our choice of cooling rate of 100°C/min on
the point that we seek to develop a representative PVT model for
the bulk of the polymer. Further, this rate represents a realistic
upper limit to the measurement capability of the DSC. Thermal lag
effects, which are already quite noticeable at 50°C/min, could
become significant at very high cooling rates making it difficult
to assess how much of the shift is due to the delayed nucleation
vs. thermal lag of the DSC apparatus. It would be attractive to
consider using Jaentsch-Kreigl’s scheme [8] for correction
of thermal lag effects to see how we could improve the quality of
the data. It should be noted however, that the application of such
a correction will only define the ‘actual’ cooling rate
of the DSC experiment. Since the DSC data are used solely to provide
a representative transition from the melt to the solid state, the
impact of this approximation is diminished. It has no bearing on
solid state PVT data and the final solid state behavioral characteristics
of the injection molded part since these are taken from actual PVT
experiments. This would not be the case if a crystallization kinetics
model was used to calculate the solid state PVT data where a precise
characterization of the model would be vital. Further, the present
uncertainty about the universal acceptability of such models [9]
would make such a kinetics based scheme less robust.
Conclusions
Molding simulation programs have been hampered in their ability
to predict shrinkage of semi-crystalline plastics. The inability
of conventionally generated PVT data to properly
represent the crystallization phenomenon has been a factor. We have
defined an elegant scheme to assemble a representative PVT model
for injection molded parts. This model is created from experimental
data that can be generated with currently available technology.
It does not rely upon crystallization kinetics models which are
as yet, not universally proven. It will permit us to use the PVT
models currently available with the major mold analysis programs
without modification. In future, with advances in the modeling of
crystallization kinetics, it may be possible to better model the
transition from melt to solid based on the original data.
Acknowledgements
We acknowledge the contributions of Craig Montoya who performed
the PVT measurements and Michael Tylenda who performed the DSC measurements.
Thanks also to Dr. Paul Zoller, University of Colorado, Dr. Gibson
Batch of 3M and to Dr. Charles Tucker of the University of Illinois
for their valuable comments.
References
1. V. W. Wang and C. Hieber, ANTEC ’88 Proceedings, 290 (1988)
2. Y. Fakhreddine and P. Zoller, ANTEC ‘91 Proceedings, 1642
(1991)
3) Characterizing Polymers for C-MOLD Simulations, 3rd Ed. AC Technology,
Ithaca NY (1994)
4) Gnomix Inc., 3809 Birchwood Drive, Boulder CO 80304
5) P. Zoller, P. Bolli, V. Pahud, and J. Ackermann, Rev. Sci. Instrum.,
47, 948 (1976)
6) J. He and P. Zoller, ANTEC’92 Proceedings, 1144 (1992)
7) R. M. Shay, Jr., P. H. Foss, and C. C. Mentzer, ANTEC’96
Proceedings, 496 (1996)
8) G. Eder, H. Janeschitz-Kriegl, Proc. IX Annual Meeting of PPS,
452 (1993)
9) T. V. Chan, G. D. Shyu and A. I. Isayev, Polym. Eng. Sci. 35,
733 (1995)
|
|
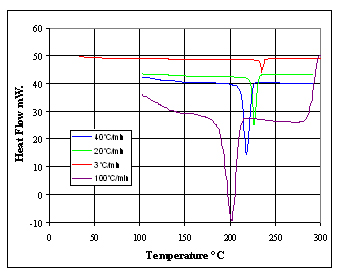
Figure 1. DSC measurements at different cooling rates
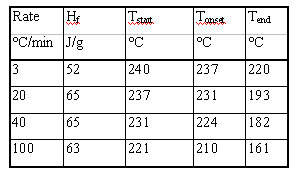
Table 1. Peak Analysis of DSC data at different cooling rates
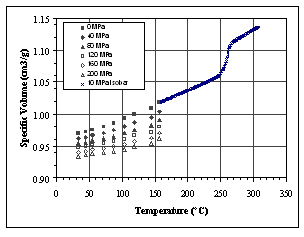
Figure 2. Solid state PVT of the injection molded part with a heating
transition
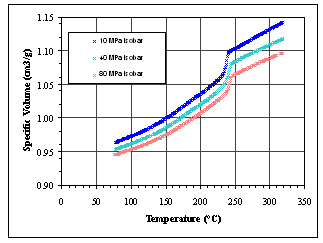
Figure 3. Isobaric cooling experiments
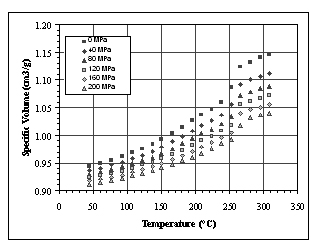
Figure 4. Isothermal cooling experiments
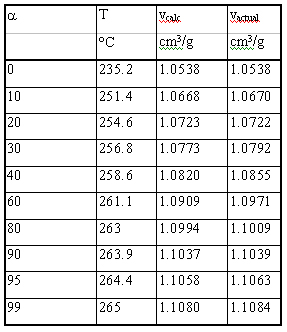
Table 2. Conversion, predicted and actual specific volume vs Temperature
at +3 °C/min
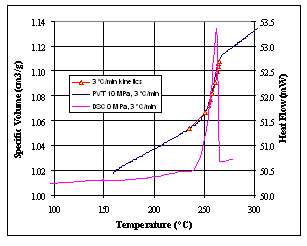
Figure 5. Comparison of experimental and calculated PVT data; DSC
cooling experiment is superimposed
|
