| |
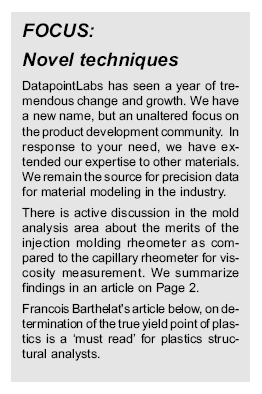
 Recent acquisitions include a Perkin
Elmer DMA 7e (left) for creep, relaxation and visco-elastic characterizations
and a TGA 7 (right), for degradation and other thermo-gravimetric
studies.
Creep
Creep data has historically been very difficult
to come by because of the excessive time needed to make these measurements.
The non-linear nature of creep in plastics makes it necessary to
perform tests at multiple stresses and temperatures. In 2000, we
added 28 new creep frames. These instruments can span a wide range
of loads, from 25 to 1200 N, and temperatures between 0 and 140°C,
permitting development of detailed material models suitable for
simulation. Measurements can be made in tension, compression and
flexure.
Thermal Analysis
Thermal analysis involves the measurement of
changes in material properties with temperature. DatapointLabs now
has an complete line-up of thermal analysis instruments, including:
Recent acquisitions include a Perkin
Elmer DMA 7e (left) for creep, relaxation and visco-elastic characterizations
and a TGA 7 (right), for degradation and other thermo-gravimetric
studies.
Creep
Creep data has historically been very difficult
to come by because of the excessive time needed to make these measurements.
The non-linear nature of creep in plastics makes it necessary to
perform tests at multiple stresses and temperatures. In 2000, we
added 28 new creep frames. These instruments can span a wide range
of loads, from 25 to 1200 N, and temperatures between 0 and 140°C,
permitting development of detailed material models suitable for
simulation. Measurements can be made in tension, compression and
flexure.
Thermal Analysis
Thermal analysis involves the measurement of
changes in material properties with temperature. DatapointLabs now
has an complete line-up of thermal analysis instruments, including:
DSC: enthalpy
and specific heat.
TMA: linear
and volumetric expansion.
DMA: mechanical
and visco-elastic properties including creep and stress relaxation.
Laser Flash:
thermal diffusivity.
TGA: weight
loss due to evaporation or degradation.
Rheology
Viscosity data are essential to the understanding
of processing phenomena. To meet the needs of our research clients
and TAP partners, we acquired capability to perform melt tensile
tests using a Goettfert Rheotens, laser die swell measurements,
slit die capability, viscous heating measurements, and a comprehensive
collection of rheometry dies that permit the investigation of phenomena
such as slip, entrance and exit effects and ultrahigh shear rate
viscosity. Biaxial extensional viscosity measurements are made using
a lubricated squeezing technique, yielding input data for the KBKZ
and G'Sell models.
Measuring true yield point of plastics
Plastic deformations can cause irreversible damage
in plastic parts well before the traditional yield point. In order
to design good parts, it is vital to know at what point these deformations
start to be significant.
A common mechanical test for plastics is the tensile test. A specimen
is stretched at a constant speed, and the forces are recorded. A
stress-strain curve can then be derived. Often the yield point?i.e.,
the point at which plastic deformation begins' is assumed to be
at the maximum of the stress strain curve, when the force starts
to decrease. This concept is known to be erroneous, as it has been
shown that plastic flow starts before this point. This maximum on
the curve actually corresponds to the point where the specimen becomes
unstable and a neck forms.
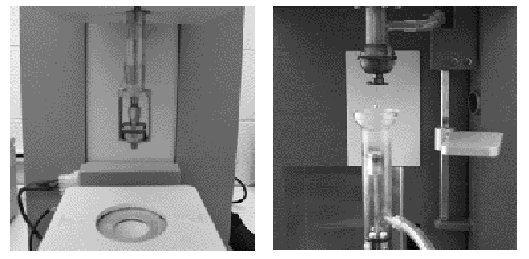
The stress-strain curve can be decomposed into the following regions
as suggested by Courtney [1], and illustrated in Fig.1:
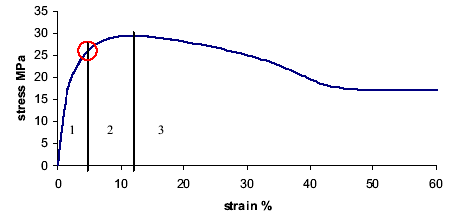 Figure 1. Stress strain curve showing
the 3 different regions. The true yield point is
Figure 1. Stress strain curve showing
the 3 different regions. The true yield point is
circled.
True yield point determination of plastics
The first region corresponds to viscoelastic
(recoverable) deformations.
The second region starts at what we will now call the true yield
point of the material. Plastic deformations become significant,
through craze formation and/or homogeneous flow (shear bands).
The third region corresponds to the formation
of a neck in the specimen. The deformation is dominated by a massive
homogeneous flow in the drawing regions.
The purpose of the true yield point test is to determine the location
of the actual yield point on the stress-strain curve. The general
idea of the procedure is to load the specimen, let it relax and
measure the residual deformation after a fixed period of time. This
procedure has been used before [2,3] with success on PMMA, PS and
PC. Here, several samples were deformed up to different strain levels,
and then unloaded and measured after a given recovery time. The
residual strains could then be plotted as a function of the initially
applied strains. When the initial deformation exceeded the plastic
limit of the material, a dramatic increase of residual strain was
observed. It has also been shown [2] that this limit is independent
of the time allowed to the material to recover. This property has
been used in this present procedure to reduce the duration of the
test.
The residual extensions after the first couple of cycles are low
and linearly increasing (Figure 2). These residual deformations
correspond to residual viscoelastic strains. For larger imposed
extensions (around 4-5 mm), the residual deformations become much
larger, as some plastic residual strains are also accumulated.
Figure 2. Plot of residual extension
vs initial applied extension.
To measure the true yield point from the curve, an onset or an intercept
type construction may be applied. Of these, the onset construction
presents a more conservative picture of this phenomenon.
References
1. "Mechanical behavior of materials",
Thomas
H. Courtney, McGraw-Hill Series in Material
Science and Engineering (1990).
2. "Components of non-elastic deformation
in amorphous glassy polymers", R. Quinson,
J. Perez, Journal of Material Science 31
(1996) p. 4387-4394
3. "Yield criteria for amorphous glassy polymers",
R. Quinson, J. Perez, Journal of Material
Science 32 (1997) p. 1371-1379
Francois Barthelat holds an MS in Mechanical
Engineering. He is currently pursuing a
Ph.D at the Univ. of Illinois.
Viscosity measurement techniques: Injection
molding vs capillary rheometers
Viscosity data are among the most critical of all the material properties
used in mold filling analysis. Consequently, it is not surprising
that there has been controversy from the beginning about the best
way to measure this important property. Capillary rheometers have
been used historically for such measurements and these continue
to provide greater than 90% of the viscosity data in the world today.
Capillary rheometers were chosen over other techniques such as cone
and plate rheology because they came closest to the kind of flow
regime that is seen in injection molding.
Questions about suitability of capillary rheometer data have continued
to exist, however. In an attempt to bring the data closer to the
?real life scenario?, attempts were made to use an injection molding
machine as a rheometer. The work of Tseng [1] reflects these early
efforts. The authors found good comparability with capillary rheometer
data for polypropylene. Polystyrene did not fare as well. Further,
while they obtained data at high shear rates, the lack of low shear
data compromised the development of a good viscosity model. These
factors placed doubts about whether the injection molding technique
had advantages over capillary rheometry.
Last year, Amano et al [2] published results from a novel injection
molding rheometer, capable of very high shear rates. According to
the authors, their primary reasons for using the instrument was
to provide the right shear history and to have a ready source of
melt for the very high shear rate measurements. This instrument
again showed viscosity data comparable with capillary rheology.
It is not in widespread use due to the high cost associated with
the acquisition and use of the instrument.
More recently, Newman[3] showed comparison data
between capillary rheology and the Moldflow injection molding rheometer.
In this work, a number of materials were tested including filled
and unfilled materials. The work showed good comparison between
the instruments for most materials, showing once again that capillary
viscosity data is indeed acceptable for injection molding simulation.
There were two exceptions: 1) The injection molding rheometer data
was lower than the capillary rheometer data for highly filled materials.
This finding suggests that highly filled materials undergo greater
breakage in the injection molding machine than they do in the capillary
rheometer. The finding is explained by the shearing action of the
screw which is not present in the piston driven capillary rheometer.
Indeed, capillary rheology experiments at DatapointLabs using injection-molded
specimens instead of pellets substantiate these findings for highly
filled materials.
2) The injection molding rheometer shows higher viscosity than the
capillary rheometer for thermally unstable materials. Nylon 4,6,
some LCPs and other thermally unstable materials cannot withstand
the long residence times seen in a capillary rheometer. They can
undergo thermal degradation lowering the observed viscosity in the
capillary rheometer.
Conclusions
Recent studies have shown that the capillary
rheometer is suitable for the measurement of viscosity for injection
molding CAE. It produces data comparable to the injection molding
rheometer for almost all materials. It provides accurate low shear
rate data which is vital for robust viscosity model construction.
Accurate viscosity of highly filled materials can be obtained using
the capillary rheometer provided the material used for the test
has already been through an injection molding history.
The only exceptional cases are those of thermally unstable materials
which are best characterized using injection molding rheometry.
In general, considering the high cost of injection molding rheology,
little advantage is gained from its use for routine testing.
References
1. "Analysis of Rheological Data from an Automated-Injection
Molding Capillary Rheometer", H. C. Tseng et al. SPE ANTEC
Proceedings (1985), p. 716-719
2. "Pressure Dependent Viscosity of Polymer Melts", O.
Amano, SPE ANTEC Proceedings, 2000, p. 885
3. "Technical Presentation? R. Newman, Moldflow User's Conference,
2000. Hubert Lobo is President, DatapointLabs

DatapointLabs adds Sales/Mktg Director
and technical staff
We are proud to announce the appointment of S. Scott Kumpf to the
position of Director, Sales and Marketing. Scott has had a distinguished
career as co-founder and former president of Ithaca Peripherals
Inc., now Transact Technologies (NASDAQ: TACT), a manufacturer of
transaction based printers and related products.
New technical personnel
Shan Wo has joined DatapointLabs as an Associate
Engineer, working in the area of rheology, data analysis and support
for our clients who perform CAE. Shan holds a B.S. degree in mechanical
engineering from Cornell University. Shan's hobbies include rock
climbing and caving.
We would like to introduce Brian Lussier and Jamie Antosh, who have
joined our staff as Laboratory Technicians. Jamie is a regional
BMX biking champion, winning second place in the New York State
2000 championship. Brian has specialized in the measurement of mechanical
properties; Jamie, in PVT and creep.
Laboratory passes A2LA audit
DatapointLabs has once again passed its ISO Guide
25 audit through A2LA. (Here's what our A2LA assessor said about
us this year: ?It is rare to see a lab where the personnel have
such an in-depth understanding of what they are doing'.)
ISO Guide 25 is being replaced this year with ISO 17025, which aligns
the requirements for laboratory accreditation with those of the
ISO 9000 quality system series. DatapointLabs has set in place a
plan to ensure our compliance with this new standard before the
end of the year.
Download a copy of our scope of accreditation at our brand new web-site:
www.datapointlabs.com/qualitysystem.asp
TestPaks® Alliance Program
grows
DatapointLabs' TestPaks® Alliance
Program has seen significant growth in the last year. Strong alliances
have permitted the company to offer a very high level of connectivity
in terms of properties and material models for the simulation programs
of its alliance partners. 'Load & Go? capability has been added
to TestPaks® for a number of programs including ABAQUS,
ANSYS, HyperExtrude LS-Dyna, MSC.MARC, T-Sim and B-Sim.
Each TestPak® contains all the measurements required
to characterize a material according to a particular material model.
The resulting data is supplied both in a written report and electronically,
ready to load into the CAE package.
Upcoming events
NDES '01: Meet S. Scott Kumpf
and Gary Timpe at the ANSYS booth, #7500. March 5 - 8, Chicago,
IL.
SAE Week. March 5-8, Detroit, MI.SAE Week.
March 5-8, Detroit, MI.
ANTEC'01: Meet Hubert Lobo and S. Scott Kumpf at
Booth #222. May 7-10, Dallas, TX.
ABAQUS User's Conference. May 30-June 1, Maastricht,
The Netherlands. |
|
|
|